It’s 2022, so the idea of analytics in HR doesn’t surprise you, and very likely you’re familiar with HR dashboards—tools that compile data from different sources and present it visually for easy readability. (If that’s not sounding familiar, we’ve got you covered.) However, for many people, actually setting up an effective dashboard is an overwhelming task. What information should you even be measuring?
Setting up your first HR dashboard isn’t as hard as you think. You know your business and you know your business goals. Putting together an effective HR dashboard is about telling the dashboard what information you want to track, and deciding on that is as simple as defining your organization’s goals. If you don’t yet have a solid process for your HR reporting or a unified HR dashboard, read about making the business case for better HR data here.

If you’re just getting started with HR dashboards, here are some common HR metrics that are key to a winning HR department:
- Revenue per employee is a way of measuring how efficiently a company is utilizing its labor force. By dividing the company’s net income by the number of employees the company has, you can determine whether the company is overworking or underworking employees, or whether their workload is about right. For perspective, small businesses generate around $100,000 in revenue per employee, but this can depend on your industry.
- Cost per employee provides the true cost of an employee. Employees cost much more than their salary—often 1.5 times their base salary, or 25% over their base salary. This is because there are costs to recruiting, onboarding and training, employee benefits like health insurance and retirement, and payroll taxes. There can also be indirect employee expenses, such as desks and computers, software licenses, and even toilet paper! Cost per employee is an important metric that helps you determine whether you can afford to expand your workforce or whether you need to increase your revenue per employee to meet your output goals.
- Cost per hire takes into account the cost of recruiting and onboarding each new employee. This may include costs for advertising the job, use of an applicant tracking system, and time spent interviewing and training new hires.
- Training efficiency uses quantitative indicators like greater productivity, improved sales numbers, or an increase in clients to determine whether specific training is effective or not. It also relies on responses from employee surveys or positive behavioral changes to measure whether training has improved traits like professionalism or safer security practices. If training is not working, it may be time to consider alternative training methods that may be more hands-on or more interactive.
- Training expenses per employee is the total cost of training divided by the number of employees who receive training. When compared with training efficiency, this metric can show whether the training method is cost-effective or not.
- Voluntary turnover rate is the number of employees who choose to leave their jobs. You can find this number by dividing the number of employees who left by the total number of employees. If this number is high, it may indicate a number of problems such as poor management (particularly if turnover is in a certain department) or uncompetitive salaries.
- Involuntary turnover can be measured by dividing the number of employees who are terminated by the total number of employees at a company. A high involuntary turnover rate may suggest poor recruitment methods that bring in unsuitable employees. Implementation of pre-employment aptitude tests, personality tests, or trial work can help reduce the number of unsuitable hires. You may also need to consider recruiting from a new applicant pool that is more likely to provide employees whose skills match your needs.
- Absenteeism can be calculated by dividing the number of workdays missed by the total number of workdays. This number can be used to measure not just employee wellness, but also employee satisfaction since unhappy employees are more likely to take time off. Absenteeism is most useful when tracked over time since patterns in absenteeism may suggest problems in the workplace.
- Job satisfaction rate is an increasingly important measure. Younger workers are less likely to remain in positions where they are unfulfilled than previous generations were. Dissatisfied workers are costly since they lead to performance issues and faster employee turnover, resulting in constant recruitment and hiring. Your employees’ job satisfaction rate can be gleaned from data like absenteeism, productivity, and engagement, but employee satisfaction surveys with a mix of qualitative and quantitative responses are the most reliable way of measuring this.
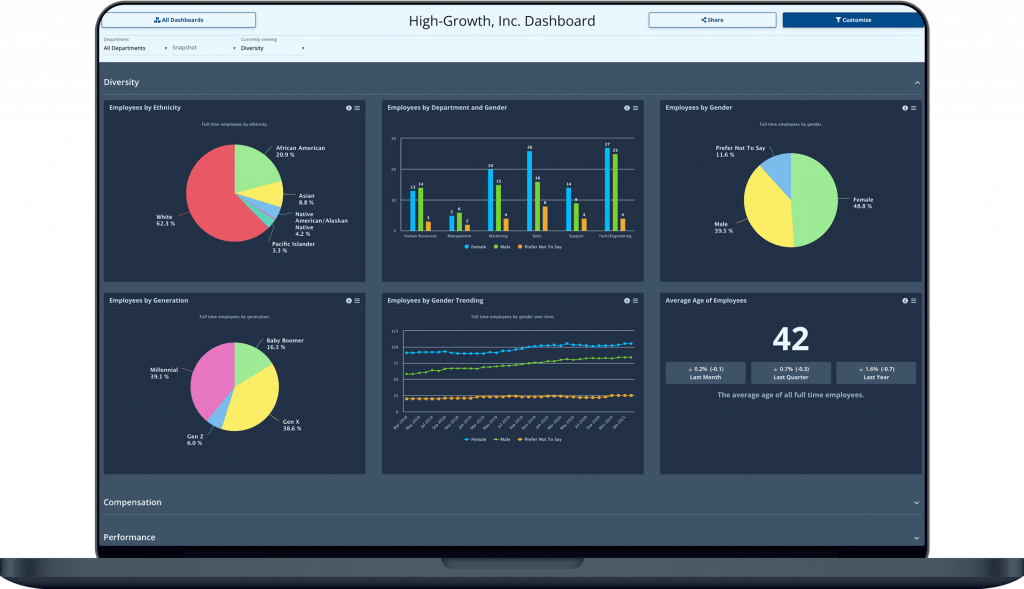
- Employees by gender is useful in creating a diversity, equity & inclusion (DE&I) initiative. See an example HR analytics dashboard below for even more examples. Recommended read: How to use data to create the ideal DEI framework

These metrics are a great place to get started with analytics, but once you’re comfortable with them you should definitely branch out to track HR metrics that are more specific to your company’s goals. And of course, if you’re having trouble setting those goals, Employee Cycle’s Data Coach can help you become more comfortable gathering, analyzing, and interpreting data correctly. Your personal coach will discuss your company’s goals, guide you through the easy implementation of the HR systems we integrate with, and help you choose the right metrics to track your progress to those goals. We’ll even check in quarterly to make sure things are going well. Schedule a free live demo today to find out more about how Employee Cycle can help your business succeed.


