4.8

Tech Website Design (3)

| The #1 Plug-and-Play UKG BI Solution​

Automated Workforce

Reporting Insights Dashboards Analysis Intelligence

Connect your HRIS and ATS — UKG, BambooHR, Greenhouse, and more — to get
instant real-time, actionable dashboards and reports. No BI. No coding. Just clarity.

Join our growing customer community powering workforce analytics for 1M+ employees

HR Spreadsheets Suck!

Let’s be honest: spreadsheets and BI make HR work way harder than it needs to be—
codes, cleanup, and confusion just to answer one simple question.

Watch the film

Meet Plug & Play BI.

Designed for HR

Your no-code analytics companion.

0 %

Data Accuracy Across All HR Systems

Employee Cycle standardizes formulas, cleans data, and resolves inconsistencies automatically — giving HRIS and reporting teams a single, reliable source of truth without writing validation rules.

0 X

Reduction in Ad-Hoc Report Requests

When leaders can self-serve dashboards and drilldowns, HR report builders spend dramatically less time responding to “Can you pull this for me?” emails.

0 %

Fewer Manual Data Errors

Because metrics are already calculated (turnover, headcount, DEI, tenure, etc.), HRIS analysts stop rebuilding logic or troubleshooting broken BI formulas.

0 X

More Reporting Coverage With the Same Team

No-code reporting allows even non-technical HR staff to create dashboards and metric views — expanding reporting capacity without hiring additional analysts.

The HR Tool Everyone’s Talking About.​

Built for HR teams who need fast, reliable answers — without BI complexity or technical hurdles. Employee Cycle makes workforce insights easy to build, easy to share, and easy to trust.

15 Sec.

Comanyies take up to 15 seconds on average to create 1 new custom multi-variable report.

85%

Companies choose Employee Cycle for Ease-of-use.

5 Days

Companies say Employee Cycle delivers value in less than 5 days after onboarding.

75%

Companies feel HR is 75% more strategic and data-driven with Employee Cycle.

If you can click, you can build.

Industry: Banking

Headcount: 2,500+

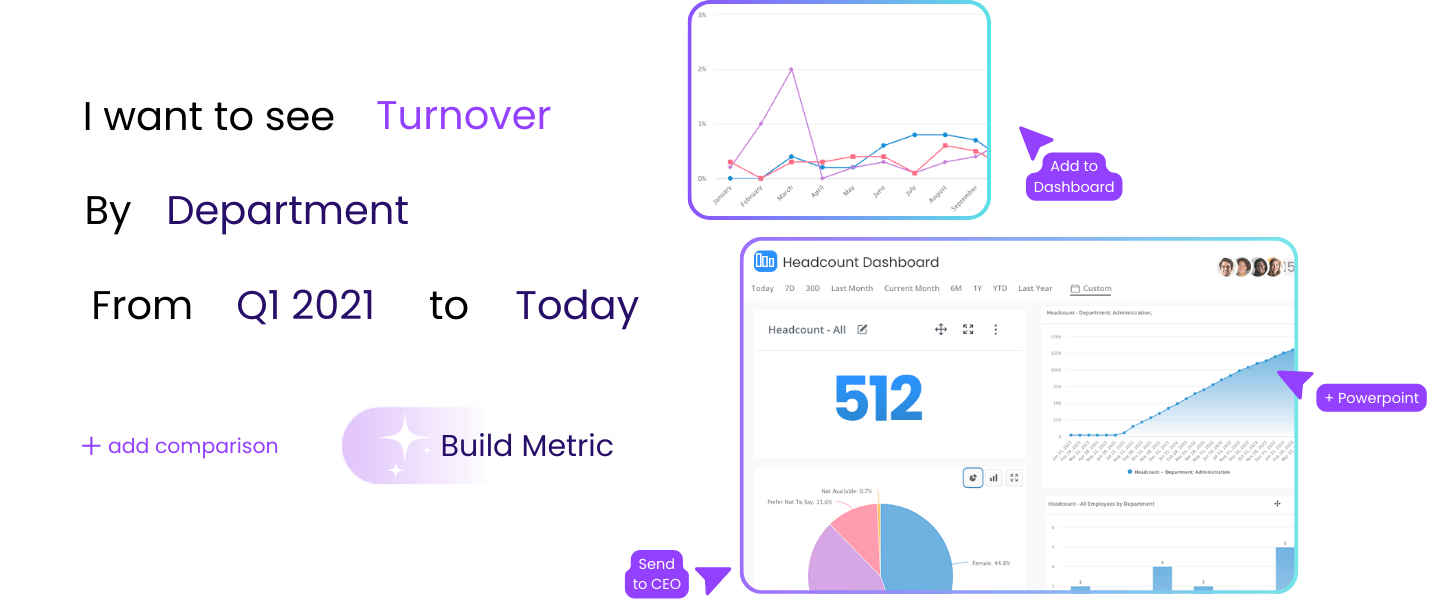
Workforce Reporting That Works
as Fast as You Do

Employee Cycle flips the script. Connect your HR data today and get live, executive-ready dashboards in under 24 hours. When you’re ready to grow, point and click to create new reports in seconds — no code, no complexity.

The “Why Is This Happening?” Problem

What's hard today?

Quick Multi-dimensional Analysis
➜Turnover spikes without clear explanations. ➜Managers guessing instead of diagnosing. ➜Data spread across reports, timeframes, and dimensions.

Why Employee Cycle

Dynamic data querying and fliters
➜ Slice turnover by manager, tenure, job family, location, pay band, DEI. ➜Compare “leavers vs stayers”. ➜ Spot patterns HR can actually act on.

Our Value

Ultimate workforce data visibility
👉 Context, not just numbers — and answers leadership trusts.

Learn How To Automate Your HR Analytics and Reporting Process

    Get more out of your data

    Try Employee Cycle unrestricted for 14 days. We can get you started right after your demo.
     
    No credit card needed ✦ our 14-day free trial is activated after a quick guided walkthrough.